Statistics
Licensure —Three-Year 1st Time Pass Rate
| Pass Rate | 2022 | 2023 | 2024 |
| Malone PN | 100% | 100% | 91% |
| Malone RN | 91% | 100% | 86% |
| Saranac Lake PN | 91% | 94% | 77% |
| Saranac Lake RN | 100% | 87.5% | 85% |
| Ticonderoga PN | 100% | 100% | 100% |
| Ticonderoga RN | 88% | 100% | 82% |
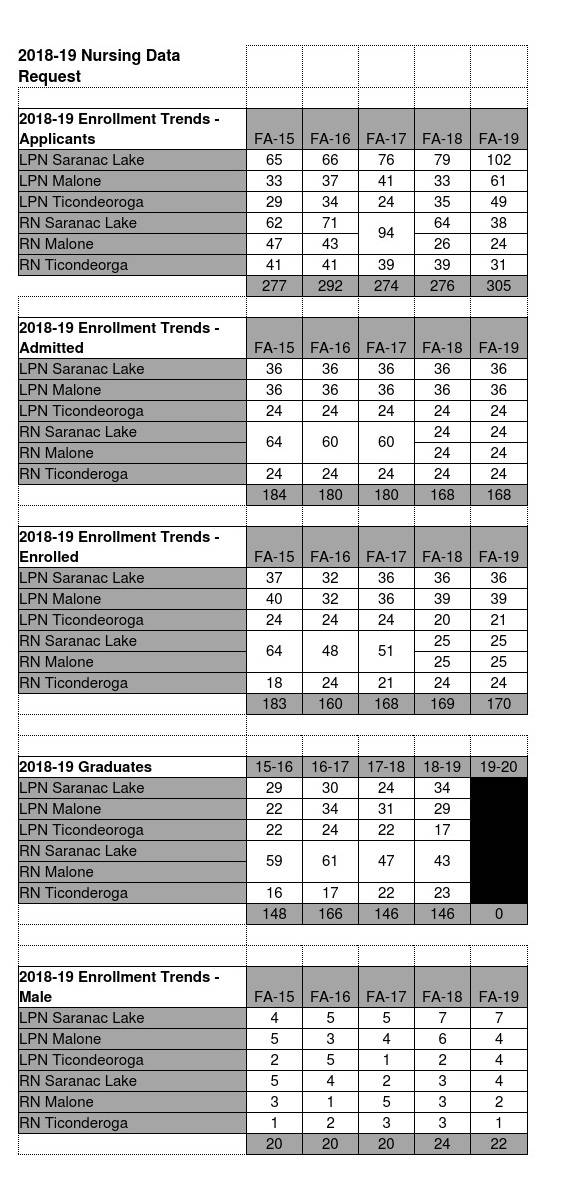
Nursing Program Enrollment Trends (Click image for more detail)
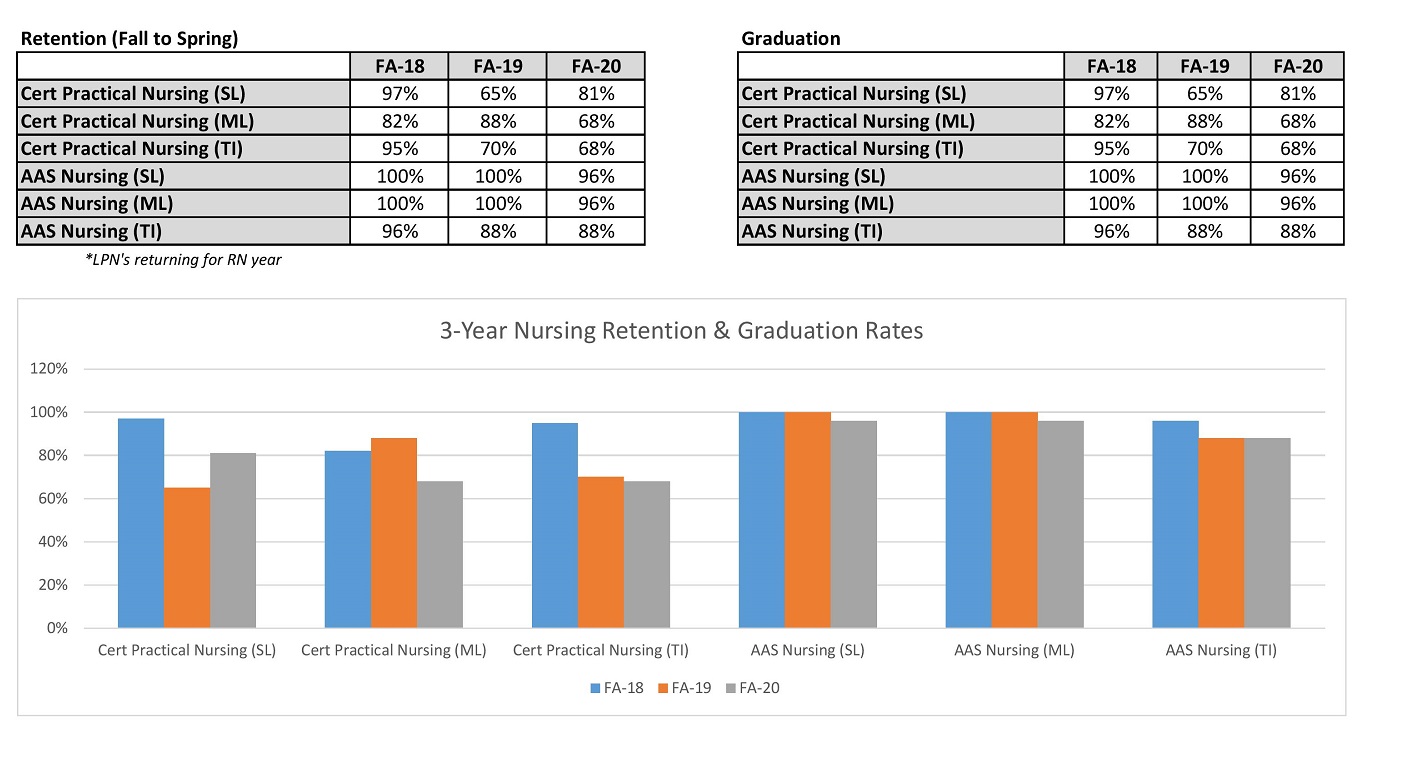
 Nursing Retention and Graduation Rates

OVERALL LPN NURSING ACCEPTANCE PATTERN – FALL 2017
Applications:
- 374 applications received, of which 273 were complete
- 111 students offered admission
|
|
Malone |
Saranac Lake |
Ticonderoga |
Total |
|
Acceptance |
37 |
49 |
25 |
104 seats (111 accepted) |
|
Deferred |
13 |
17 |
5 |
35 |
|
Accepted GPA Range |
3.88-2.5 |
4.0-2.5 |
4.0-2.76 |
3.96-2.579 |
|
Accepted GPA Mean* |
3.134 |
3.43 |
3.43 |
3.33 |
Overall LPN Nursing Breakdown of Enrollment Status
|
|
Malone |
Saranac Lake |
Ticonderoga |
Total |
|
Current students |
14/37 |
17/49 |
14/25 |
45 |
|
Readmit |
10/37 |
6/49 |
2/25 |
18 |
|
Transfer |
4/37 |
10/49 |
7/25 |
21 |
|
First-time |
9/37 |
16/49 |
2/25 |
27 |
OVERALL LPN NURSING ACCEPTANCE PATTERN – FALL 2018
Applications:
- 387 applications received, of which 274 were complete
- 96 students offered admission
|
|
Malone |
Saranac Lake |
Ticonderoga |
Total |
|
Acceptance |
36 |
41 |
19 |
104 seats (96 accepted) |
|
Deferred |
32 |
23 |
11 |
66 |
|
Accepted GPA Range |
4.0-2.57 |
4.0-2.54 |
4.0-2.77 |
4.0-2.543 |
|
Accepted GPA Mean* |
3.09 |
3.19 |
3.21 |
3.163 |
Overall LPN Nursing Breakdown of Enrollment Status
|
|
Malone |
Saranac Lake |
Ticonderoga |
Total |
|
Current students |
20/36 |
8/41 |
6/19 |
34 |
|
Readmit |
4/36 |
1/41 |
4/19 |
9 |
|
Transfer |
6/36 |
8/41 |
7/19 |
21 |
|
First-time |
6/36 |
24/41 |
2/19 |
32 |
OVERALL LPN NURSING ACCEPTANCE PATTERN – FALL 2019
Applications:
- 401 applications received, of which 279 were complete
- 105 students offered admission
|
|
Malone |
Saranac Lake |
Ticonderoga |
Total |
|
Acceptance |
45 |
41 |
19 |
104 seats (105 accepted) |
|
Deferred |
20 |
17 |
17 |
66 |
|
Accepted GPA Range |
4.0-2.57 |
4.0-2.54 |
4.0-2.77 |
4.0-2.543 |
|
Accepted GPA Mean* |
3.09 |
3.19 |
3.21 |
3.163 |
Overall LPN Nursing Breakdown of Enrollment Status
|
|
Malone |
Saranac Lake |
Ticonderoga |
Total |
|
Current students |
30/45 |
8/41 |
5/19 |
43 |
|
Readmit |
5/45 |
5/41 |
2/19 |
12 |
|
Transfer |
3/45 |
14/41 |
11/19 |
28 |
|
First-time |
7/45 |
14/41 |
1/19 |
22 |
NCLEX-PN Pass Rates
|
|
PN ML Pass Rate |
PN SL Pass Rate |
PN Ti Pass Rate |
State Average PN Pass Rate |
National Average PN Pass Rate |
|
2022 |
100% |
90.9% |
100% |
74.45% |
79.93% |
|
2021 |
62.75% |
62.75% |
88.89% |
70.49% |
79.6% |
|
2020 |
62.07% |
81.82% |
77.78% |
70.5% |
78.73% |
|
2019 |
79.3% |
80% |
88.89% |
79.8% |
85.63% |
|
2018 |
95.8% |
100% |
80.95% |
79.9% |
85.91% |
|
2017 |
70% |
87.5% |
80.0% |
71.7% |
83.84% |
|
2016 |
87.5% |
100% |
90.9% |
76.5% |
83.73% |
|
|
ADN ML Pass Rate |
ADN SL Pass Rate |
ADN Ti Pass Rate |
State Average ADN Pass Rate |
National Average ADN Pass Rate |
|
2022 |
90.91% |
100% |
87.5% |
73.49% |
79.91% |
|
2021 |
45% |
41% |
45% |
77.33% |
82.48% |
|
2020 |
82.61%* |
85.19%* |
75% |
70.99% |
78.44% |
|
2019 |
95.35% |
95.35% |
65.2% |
86.4% |
86% |
|
2018 |
83.02% |
83.02% |
80% |
86.3% |
85.1% |
|
2017 |
95.9% |
95.9% |
75% |
83.8% |
84.2% |
|
2016 |
46.4% |
46.4% |
44.4% |
82% |
81.7% |
